

McColl Display Solutions focus is on exceeding customer expectations on all your tile showroom displays, tile display racks, merchandising displays and tile sample board needs through exceptional customer service. McColl Display Solutions has been designing and manufacturing showroom merchandising displays and sample boards for over 30 years. All our displays and boards are made to the customers specifications and are manufactured in Ocala, FL. Our custom tile showroom display and marketing concept team has the experience and creativity to develop the right ceramic tile displays to attract attention; showcase your product, increase sales and to fit within your budget. Showroom merchandising displays are a critical part of your marketing plan. The proper use of ceramic tile display or showroom displays can set your product apart from the competition and drive up your sales.
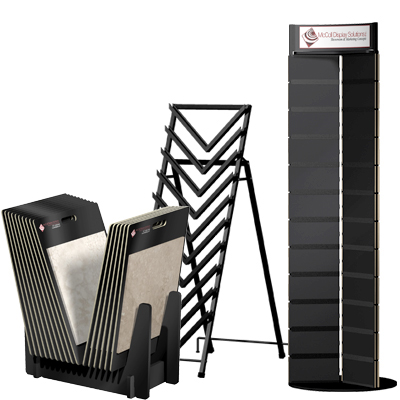
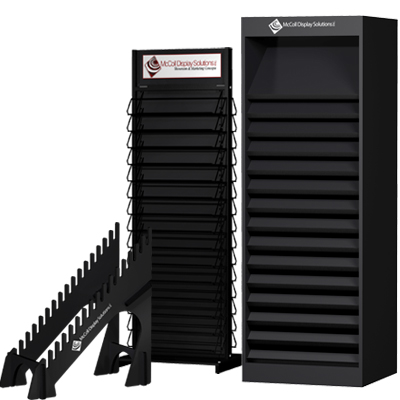
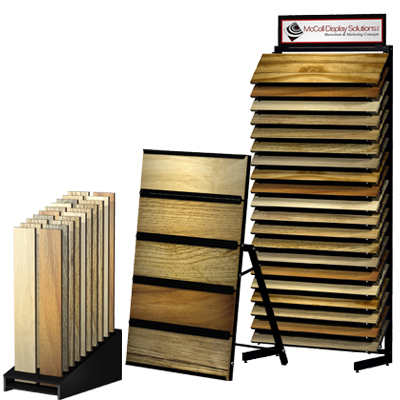
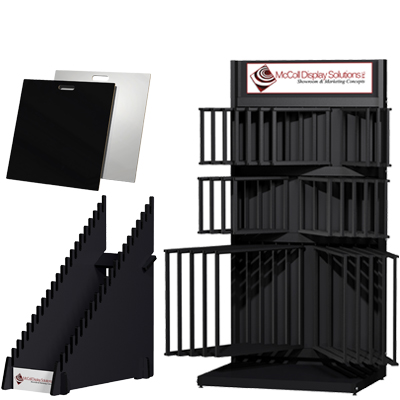
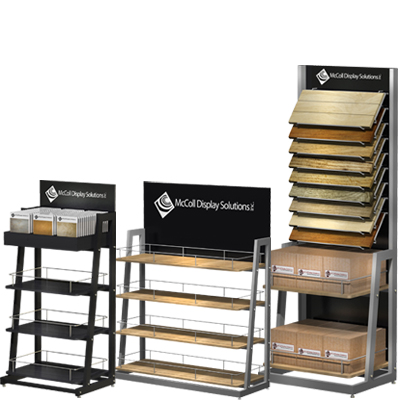
Designing and manufacturing showroom displays for ceramic tile; stone, marble, granite; hardwood and laminate. Our full line of ceramic tile displays, stone marble granite laminate and hardwood flooring displays are all made to fit any product size and thickness.
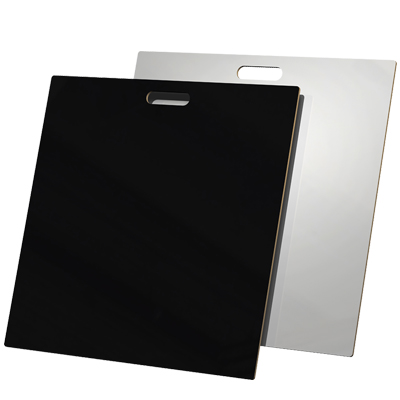
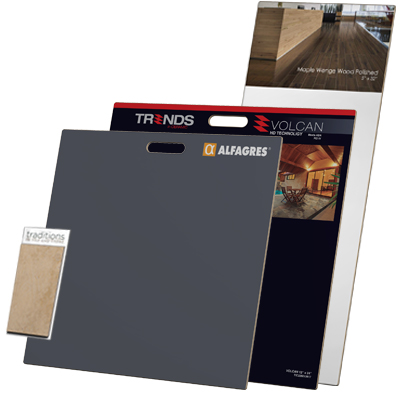
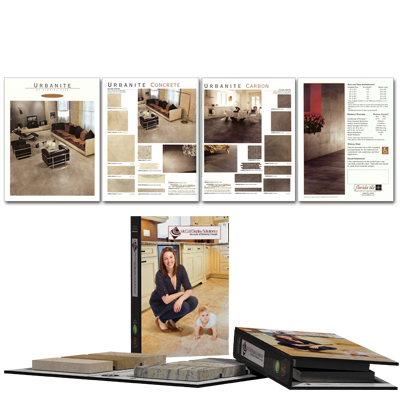
We also offer a full line of ceramic tile boards. Our tile sample boards are made from the highest quality MDF or PVC plastic - your choice! Each of our tile sample boards are made to your specifications. Logos can be screen-printed or full color logo, room scene and full brochure-style description UV-coated prints applied on our tile sample boards. Sample board, also known as swatch boards, concept boards, handheld board, hardboard, panel and dealer display boards are an excellent sales tool as part of your ceramic tile displays. Our sample boards made from MDF or PVC plastic can be made in any color and the color on the MDF boards can be on one side or both sides. All sample boards can have the option of screen-printing or full four-color process printing to brand and identify your product. We also offer full turnkey service - which includes mounting of your product and drop shipping to your clients.
As you browse through our merchandising tile display concept images; please keep in mind that each tile showroom display you see can be adapted to your flooring product and your display needs.
Ready to Order? Simply email us at info@mccolldisplay.com or call us at 877.408.8349 and we will be happy to quote your tile showroom sample display needs.
Display and board sales are final unless defective. Please inspect freight at time of delivery and report any damage immediately.